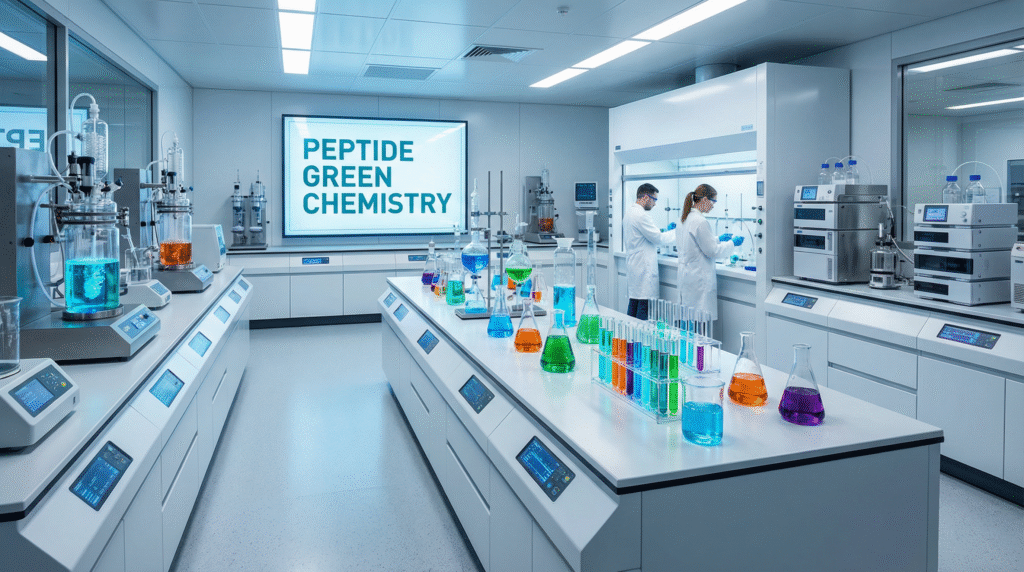
The pharmaceutical industry faces a sustainability imperative as peptide therapeutics surge toward a $75 billion market by 2028, with traditional manufacturing processes generating 2.5-4.0 kg of waste per gram of active pharmaceutical ingredient (API)—representing an environmental burden that contradicts the health benefits these molecules provide. Green chemistry metrics have emerged as critical tools for quantifying and improving the sustainability of peptide manufacturing, with Process Mass Intensity (PMI) and Environmental Factor (E-Factor) serving as cornerstone measurements that enable manufacturers to reduce waste, lower costs, and meet escalating regulatory and consumer demands for environmentally responsible production.
This comprehensive analysis examines how leading peptide API manufacturers are leveraging these metrics to achieve 40-60% reductions in material consumption, 50-70% decreases in solvent waste, and 30-50% lower energy usage while maintaining the stringent quality standards required for pharmaceutical applications.
Introduction: The Green Chemistry Imperative in Peptide Pharmaceuticals
The adoption of green chemistry principles in peptide manufacturing represents both an environmental necessity and a strategic business advantage. With healthcare accounting for 4.4% of global carbon emissions and pharmaceuticals representing the fastest-growing segment, pressure from regulators, investors, and patients is driving rapid transformation toward sustainable practices.
Green chemistry metrics provide quantifiable measurements that enable peptide manufacturers to:
- Track and optimize resource efficiency across synthetic pathways.
- Benchmark performance against industry standards and competitors.
- Identify opportunities for process improvement and waste reduction.
- Demonstrate environmental responsibility to stakeholders and regulators.
- Reduce costs through improved material utilization and waste management.
“Green chemistry metrics are transforming peptide manufacturing from an art to a science. By quantifying environmental performance, we can make data-driven decisions that benefit both the planet and the bottom line.” — Dr. Elena Rodriguez, Director of Sustainable Manufacturing, Global Peptide Innovators.
Understanding Process Mass Intensity (PMI) in Peptide Manufacturing
Process Mass Intensity has emerged as the most comprehensive metric for evaluating the material efficiency of peptide synthesis processes, providing a holistic view of resource utilization from raw materials to final API.
Definition and Calculation of PMI
PMI represents the total mass of materials used in a process per unit of product obtained, calculated as:
PMI = Total Mass of Materials Used (kg) / Mass of Product (kg)
For peptide synthesis, this includes all materials entering the process:
- Raw materials (amino acids, resins, reagents).
- Solvents (DMF, DCM, acetonitrile, etc.).
- Water and utilities.
- Process aids and catalysts.
An ideal PMI value is 1, indicating perfect efficiency where all inputs are incorporated into the final product. Typical peptide synthesis processes have PMI values ranging from 25 to 150, highlighting significant improvement opportunities.
PMI Benchmarks for Peptide APIs
Industry benchmarks reveal substantial variation in PMI based on synthesis technology and process optimization:
| Process Type | Typical PMI Range | Best-in-Class PMI | Key Improvement Opportunities |
|---|---|---|---|
| Traditional Solid-Phase Peptide Synthesis (SPPS) | 80-150 | 35-45 | Solvent recovery, reduced excess reagents |
| Liquid-Phase Peptide Synthesis | 60-120 | 25-35 | Continuous processing, catalyst optimization |
| Hybrid Solution-Solid Phase | 40-80 | 20-30 | Process intensification, waste minimization |
| Continuous Flow Peptide Synthesis | 25-50 | 15-25 | Real-time optimization, reduced holdup volumes |
Strategies for Reducing PMI in Peptide Production
Leading manufacturers implement multiple strategies to improve PMI:
- Solvent Selection and Recovery: Implementing closed-loop solvent recovery systems achieving 85-95% reuse rates
- Reagent Optimization: Reducing excess reagents from traditional 3-5 equivalents to 1.2-1.5 equivalents
- Process Intensification: Adopting continuous flow systems that reduce solvent usage by 60-80%
- Catalyst Efficiency: Utilizing highly selective catalysts that improve yields and reduce waste
Environmental Factor (E-Factor) Calculations for Peptide Processes
The Environmental Factor provides a focused measurement of waste generation, specifically addressing the mass of waste produced per unit of product.
E-Factor Formula and Components
E-Factor is calculated as:
E-Factor = Total Mass of Waste (kg) / Mass of Product (kg)
Waste includes all materials that do not end up in the final product:
- Spent solvents and reaction byproducts
- Process water and aqueous waste streams
- Packaging and ancillary materials
- Energy-related emissions (converted to mass equivalent)
For peptide APIs, E-Factors typically range from 20 to 100, with best-in-class processes achieving E-Factors below 15.
Industry Standards and Targets
Pharmaceutical industry targets for E-Factor have become increasingly ambitious:
- Current Industry Average: 35-45 for peptide APIs.
- Regulatory Expectations: <25 for new processes in FDA and EMA submissions.
- Leading Company Targets: <15 by 2025, <10 by 2030.
- Theoretical Minimum: 5-8 for optimized green chemistry processes.
Case Studies: E-Factor Reduction in Peptide Production
Several companies have demonstrated significant E-Factor improvements:
Case Study 1: Large-Scale GLP-1 Analog Manufacturing
- Initial E-Factor: 68 (traditional SPPS process).
- Interventions: Solvent recovery system (90% efficiency), reagent optimization, continuous purification.
- Final E-Factor: 22 (68% reduction).
- Environmental Impact: 12,000 tons annual waste reduction.
Case Study 2: Antimicrobial Peptide Production
- Initial E-Factor: 42 (liquid-phase synthesis).
- Interventions: Hybrid flow system, green solvent substitution, catalyst recycling.
- Final E-Factor: 14 (67% reduction).
- Economic Benefit: 35% reduction in manufacturing costs.
Other Key Green Chemistry Metrics for Peptides
While PMI and E-Factor provide comprehensive overviews, several additional metrics offer valuable insights into specific aspects of sustainability.
Atom Economy
Atom economy measures the proportion of reactant atoms that are incorporated into the final product:
Atom Economy = (Molecular Weight of Product / Molecular Weight of Reactants) × 100%
For peptide synthesis, atom economy typically ranges from 40-70%, with significant opportunities for improvement through:
- Protecting Group Minimization: Using minimal protection strategies.
- Convergent Synthesis: Building larger peptides from smaller fragments.
- Catalytic Methods: Reducing stoichiometric reagent usage.
Carbon Efficiency
Carbon efficiency evaluates the proportion of carbon atoms from starting materials that end up in the final product:
Carbon Efficiency = (Carbon in Product / Carbon in Reactants) × 100%
Peptide synthesis typically achieves 25-50% carbon efficiency, with improvements possible through:
- Bio-based Starting Materials: Using renewable carbon sources.
- Waste Valorization: Converting byproducts into valuable coproduc.
- Energy Integration: Reducing fossil carbon in energy inputs.
Water and Energy Usage Metrics
Water and energy consumption represent critical sustainability indicators:
- Water Intensity: Liters of water per kg API (typical: 5,000-15,000 L/kg).
- Energy Intensity: kWh per kg API (typical: 150-300 kWh/kg).
- Carbon Intensity: kg CO₂e per kg API (typical: 30-80 kg CO₂e/kg).
Implementing Green Chemistry Metrics in Peptide API Facilities
Successful implementation requires systematic approaches to data collection, analysis, and continuous improvement.
Data Collection and Monitoring Systems
Robust data infrastructure is essential for accurate metric calculation:
- Material Tracking Systems: Real-time monitoring of all material inputs and outputs.
- Automated Data Collection: Integration with manufacturing execution systems (MES).
- Environmental Monitoring: Continuous measurement of energy, water, and emissions.
- Quality Data Integration: Correlation of green metrics with product quality parameters.
Integration with Quality Management Systems
Green chemistry metrics must align with pharmaceutical quality systems:
- Change Control Procedures: Formal assessment of sustainability impacts for process changes.
- Risk Management: Incorporating environmental risks into quality risk assessments.
- Supplier Quality: Evaluating suppliers based on environmental performance.
- Continuous Improvement: Using metrics to drive ongoing process optimization.
Regulatory and Compliance Aspects
Regulatory expectations for green chemistry are increasing:
- FDA Requirements: Increasing scrutiny of environmental impacts in regulatory submissions.
- EMA Expectations: Green chemistry considerations in environmental risk assessments.
- ICH Guidelines: Q9 and Q10 providing frameworks for environmental quality risk management.
- Emerging Regulations: Carbon border adjustments and environmental product declarations.
FAQs: Peptide Green Chemistry Metrics
Q: What is the difference between Process Mass Intensity (PMI) and Environmental Factor (E-Factor)?
A: PMI measures the total mass of all materials used in a process per unit of product, providing a comprehensive view of resource efficiency. E-Factor specifically measures the mass of waste generated per unit of product, focusing on environmental impact. PMI includes both product and waste materials, while E-Factor only considers waste. PMI is always greater than or equal to E-Factor + 1.
Q: How often should green chemistry metrics be calculated and reviewed?
A: Leading manufacturers calculate green chemistry metrics for every batch, with formal reviews conducted quarterly for routine monitoring and after any significant process changes. Real-time monitoring is increasingly common with advanced process analytical technology (PAT) systems. Regulatory submissions typically require metric calculations for the commercial manufacturing process.
Q: What are realistic improvement targets for peptide green chemistry metrics?
A: Achievable targets depend on the starting point and technology employed. Typical first-year targets include 20-30% reduction in PMI and E-Factor. Long-term targets of 50-70% reduction over 3-5 years are realistic with significant process changes. Best-in-class peptide processes achieve PMI of 15-25 and E-Factor of 5-15 through advanced technologies like continuous manufacturing and solvent recovery.
Core Takeaways
- Strategic Importance: Green chemistry metrics are essential for regulatory compliance, cost reduction, and market competitiveness.
- Comprehensive Measurement: PMI provides holistic resource efficiency assessment, while E-Factor focuses on waste generation.
- Significant Improvement Potential: Most peptide processes can achieve 40-60% metric improvements through optimization.
- Technology Enablement: Continuous processing, solvent recovery, and advanced analytics drive metric improvement.
- Regulatory Evolution: Increasing regulatory emphasis on environmental performance in pharmaceutical manufacturing.
Conclusion: The Path to Sustainable Peptide Manufacturing
The adoption of green chemistry metrics represents a fundamental shift in peptide manufacturing, moving from qualitative environmental aspirations to quantitative, actionable sustainability performance. Process Mass Intensity and Environmental Factor calculations provide the foundation for this transformation, enabling manufacturers to benchmark performance, identify improvement opportunities, and demonstrate tangible progress toward sustainability goals.
As regulatory pressures intensify and customer preferences increasingly favor environmentally responsible products, peptide manufacturers that excel in green chemistry metrics will gain significant competitive advantages. The integration of these metrics into quality systems, combined with technological innovations in manufacturing processes, creates a pathway toward truly sustainable peptide therapeutics that deliver health benefits without environmental compromise. The future of peptide manufacturing lies in the continuous improvement of these metrics, driving innovation that benefits patients, companies, and the planet simultaneously.
Disclaimer:
This article contains information, data, and references that have been sourced from various publicly available resources on the internet. The purpose of this article is to provide educational and informational content. All trademarks, registered trademarks, product names, company names, or logos mentioned within this article are the property of their respective owners.
The use of these names and logos is for identification purposes only and does not imply any endorsement or affiliation with the original holders of such marks. The author and publisher have made every effort to ensure the accuracy and reliability of the information provided. However, no warranty or guarantee is given that the information is correct, complete, or up-to-date. The views expressed in this article are those of the author and do not necessarily reflect the views of any third-party sources cited.


